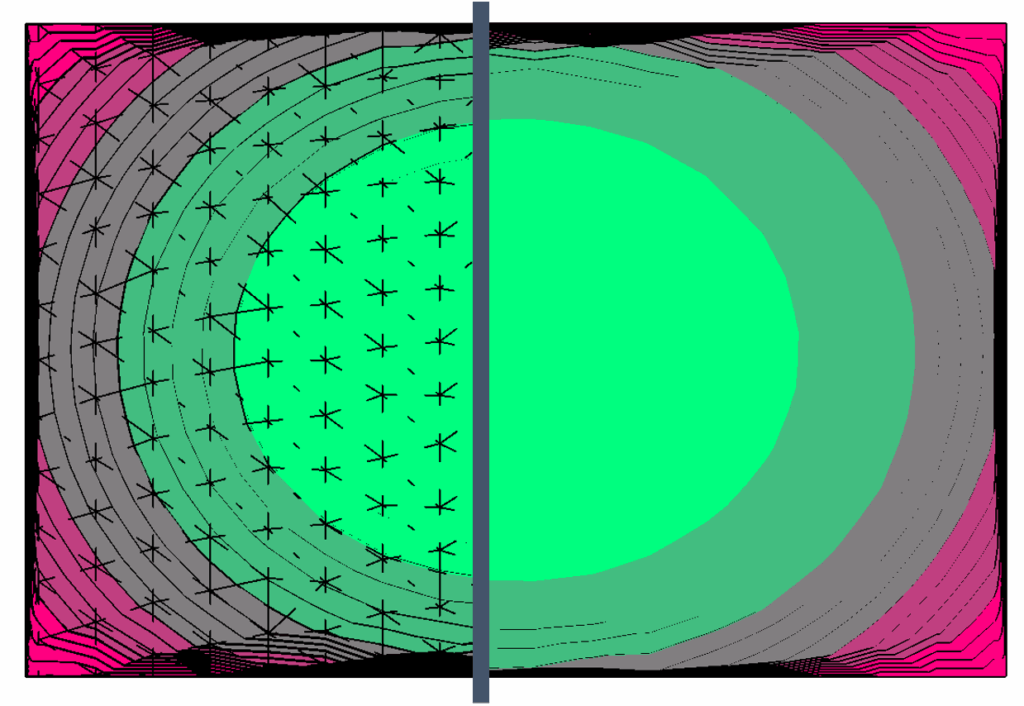
For years, users of Environment for Revit have leveraged its powerful Color Analysis tools to visualize terrain slope and elevation data directly onto their terrain models. These tools, available since early 2021, generate a colored mesh that beautifully maps information, such as topography slopes and elevation ranges. However, the triangles or facets of the underlying analysis mesh remained conspicuously visible, often detracting from the clarity and professionalism of the analysis results.
Here at Arch-Intelligence, we spent considerable time exploring workarounds, trying to mask or soften the edges so you can make better use of these powerful tools. It is with a touch of embarrassment, but mostly relief and excitement, that we can now share a discovery: the solution was there all along, hidden in plain sight within Revit’s native View Settings.
The key to unlocking a truly smooth and professional appearance for the Color Analysis results lies in a specific, almost counter-intuitive combination of settings within the Graphic Display Options menu. This discovery should dramatically improve the visualization of your Color Analysis in all your models.
The Magic Combination 🪄
To finally achieve the coveted smooth analysis appearance, follow these simple steps within your analysis view. Navigate to the Graphic Display Options (accessible from the View Control Bar or the View Properties palette). This is where the core changes will be made:
1. Visual Style Setting 🌄
Set the Visual Style to Shaded and ensure the Edges checkbox is NOT ticked.
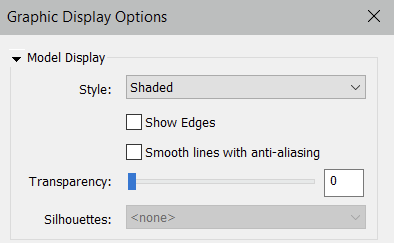
This is the foundational step. By selecting “Shaded” and explicitly turning off “Edges,” you instruct Revit not to draw the lines that delineate the model’s geometry, including the edges of the underlying analysis mesh triangles.
2. Lighting Adjustments 🕯️ *
Next, move to the Lighting section within the Graphic Display Options. The way Revit lights the model has a profound effect on how the colors and surfaces are perceived. The following settings are crucial for ensuring correct color appearance:
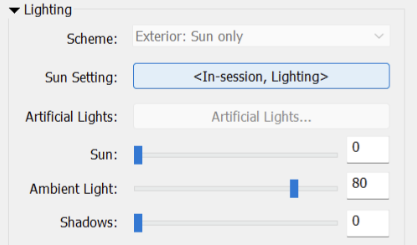
Set the Sun slider to 0 (Zero). This would keep the original shade of colors.
Set Ambient Light to 80. Ambient light creates subtle shading differences, and 80 keeps it in the natural scope.
*Updated on Jan 2026
3. Sun Settings ☀️
The final piece of the puzzle is found in the Sun Settings, which is accessible from the same Graphic Display Options menu (or the View Control Bar).
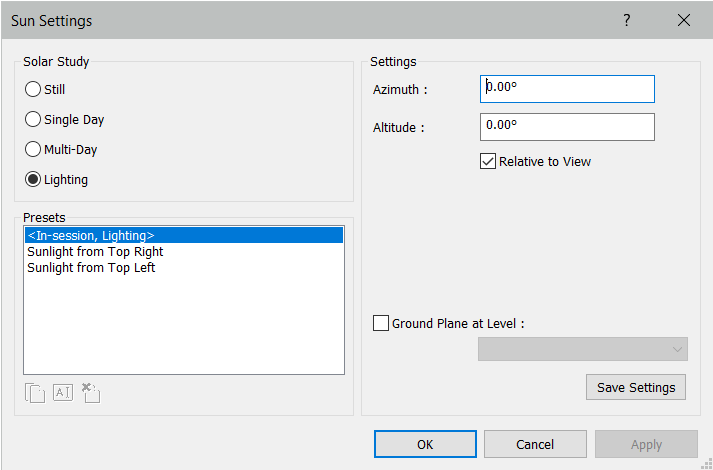
Set the Sun Settings to the <in-session lighting> option. This choice overrides specific location/time data, instructing Revit to use the simplified lighting parameters you set in the previous step (Sun at 80, Ambient at 0).
However, to fully enforce a neutral, shadow-free light source, the specific parameters within this setting must also be checked:
Azimuth: Set to 0.
Altitude: Set to 0.
Also, make sure that:
Relative to View checkbox is ticked.
Ground Plane at Level is NOT ticked.
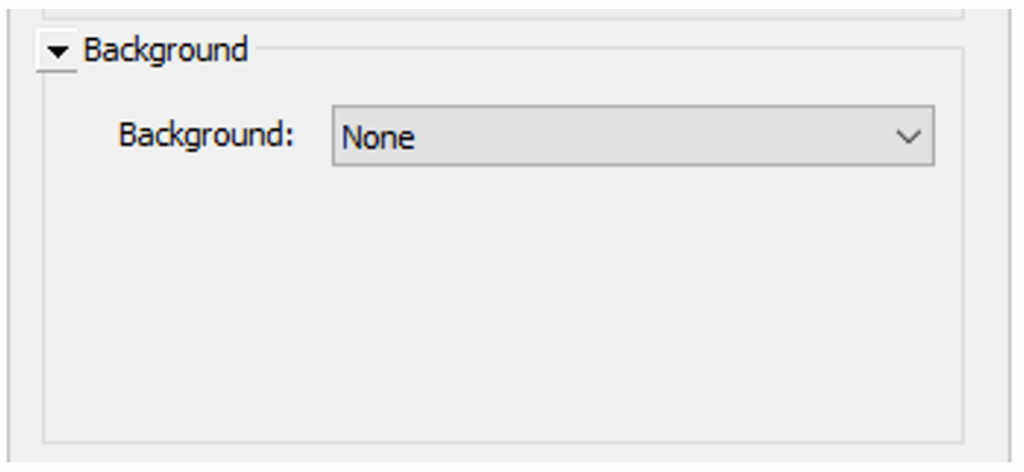
3. Background 🚩
Last but not least, please ensure that you don’t have any background in the view that you use for Color Analysis.
A New Era for Analysis Visualization
Implementing these simple steps transforms the Color Analysis results from a faceted, triangular display into a truly smooth, continuous color map.
For years, we overlooked this simple combination of settings. It serves as a great reminder that sometimes the most elegant solutions are not found in complex scripts or new features, but in a deeper understanding of the native software’s existing capabilities.
We encourage all our users to try these view settings. The difference in the visual quality of your analysis outputs is striking and will significantly enhance the communication of your simulation results. It’s a small change with a massive visual impact.